
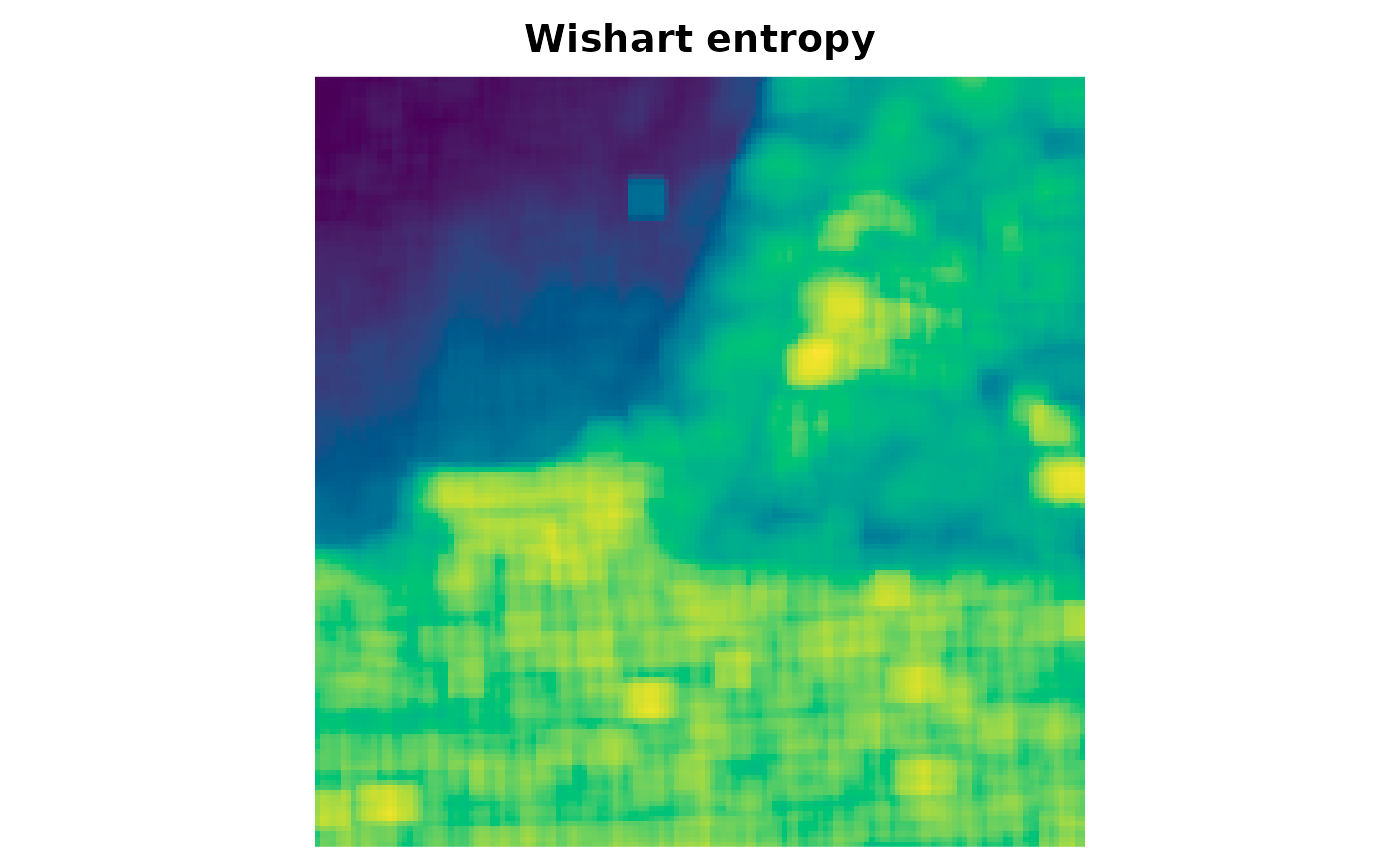
Estimates, at every pixel, the parameters of a SAR/PolSAR model with the observations inside a square moving window and returns the map of Shannon entropies (Ferreira and Nascimento, 2020; Nascimento, Ferreira and Frery, 2023). Optionally, the map of asymptotic variances of the entropy estimators is returned as well.
Usage
entropy_map(
  image,
  model = c("gamma", "g0i", "ggamma", "wishart", "g0p"),
  window = 7,
  L = NULL,
  channels = NULL,
  variance = FALSE
)
Arguments
- image
A SARImage or an array accepted by
SARImage$new().- model
One of
"gamma","g0i","ggamma"(intensity models, applied to each channel) or"wishart","g0p"(matrix models, for PolSAR images).- window
Odd side of the moving window.
- L
Known number of looks. If
NULL(default) it is estimated in every window.- channels
Channels used by intensity models (default: all).
- variance
Also return the variance map?
Value
A matrix (one channel or matrix model) or an array
nrow x ncol x channels of entropies. If variance = TRUE, a list with
elements entropy, variance and n (window sizes).
Details
For the Gamma and Wishart models the computations are fully vectorised (local sufficient statistics are obtained from integral images), so the maps are computed in a fraction of a second. The G0I, generalized Gamma and G0 polarimetric models require a numerical maximisation per pixel and are therefore slower (use small images or crops to explore them).
References
Ferreira, J. A. and Nascimento, A. D. C. (2020). Shannon entropy for the G0I model: a new segmentation approach. IEEE Journal of Selected Topics in Applied Earth Observations and Remote Sensing, 13, 2547–2553. doi:10.1109/JSTARS.2020.2997666
Nascimento, A. D. C., Ferreira, J. A. and Frery, A. C. (2023). Unsupervised segmentation of PolSAR data with complex Wishart and G0m distributions and Shannon entropy. Statistics and Computing, 33, 129. doi:10.1007/s11222-023-10298-0
Examples
img <- SARImage$new(SanFrancisco150)
H <- entropy_map(img, model = "wishart", window = 7, L = 4)
dim(H)
#> [1] 150 150
plot_map(H, main = "Wishart entropy")
 Hg <- entropy_map(img, model = "gamma", window = 7, channels = "HV")
# \donttest{
small <- img$crop(1:15, 1:15)
Hi <- entropy_map(small, model = "g0i", window = 5, L = 4, channels = 1)
# }