Displays a matrix as an image with the first row on top: continuous maps
(e.g. entropy maps) use a sequential palette and integer/factor maps
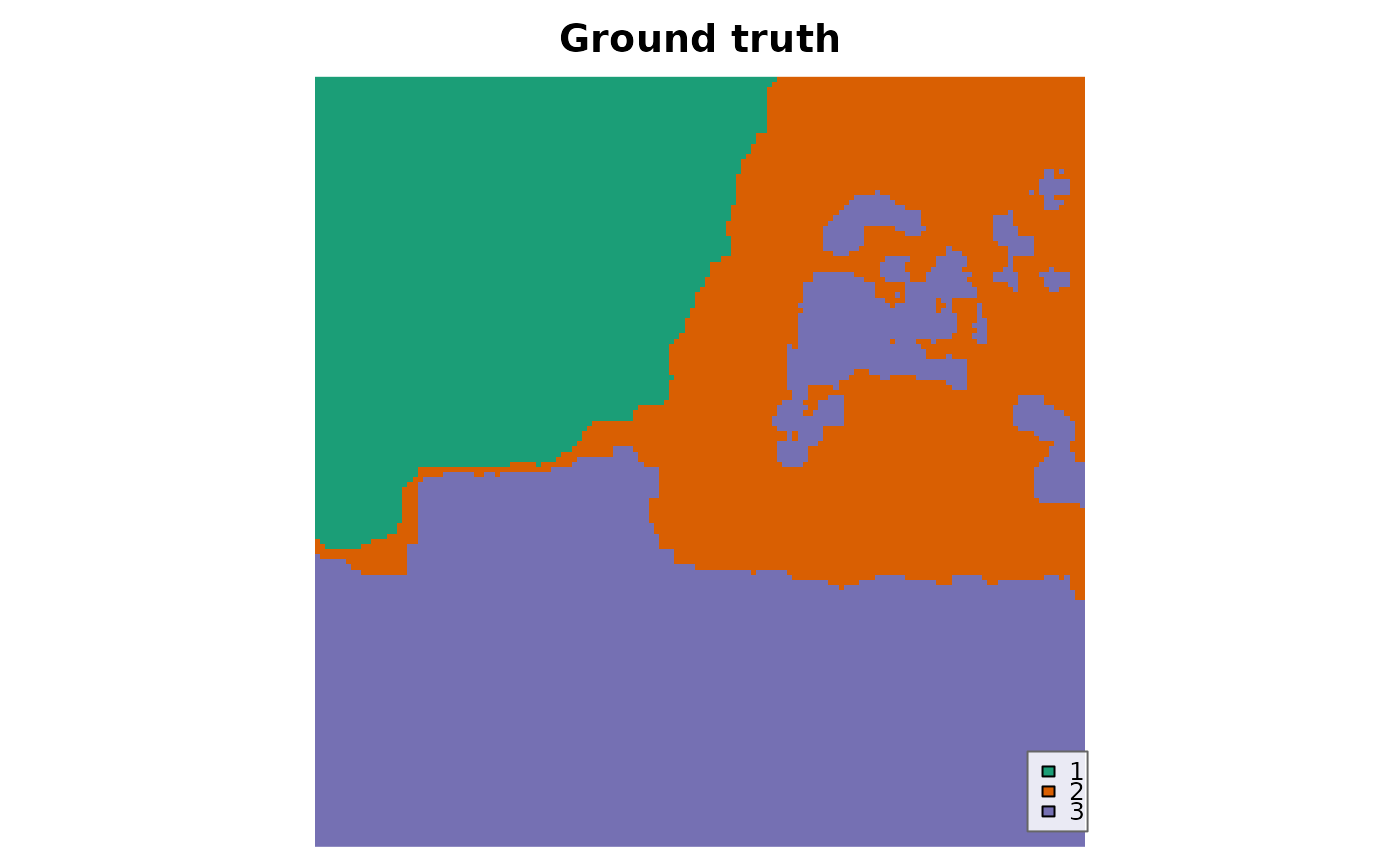
(e.g. segmentation or classification results) use a qualitative one.
Usage
plot_map(x, palette = NULL, main = NULL, legend = FALSE)
Arguments
- x
A numeric, integer, logical or factor matrix.
- palette
Optional vector of colours.
- main
Title.
- legend
Add a legend for discrete maps?
Examples
plot_map(SanFrancisco150_gt, main = "Ground truth", legend = TRUE)
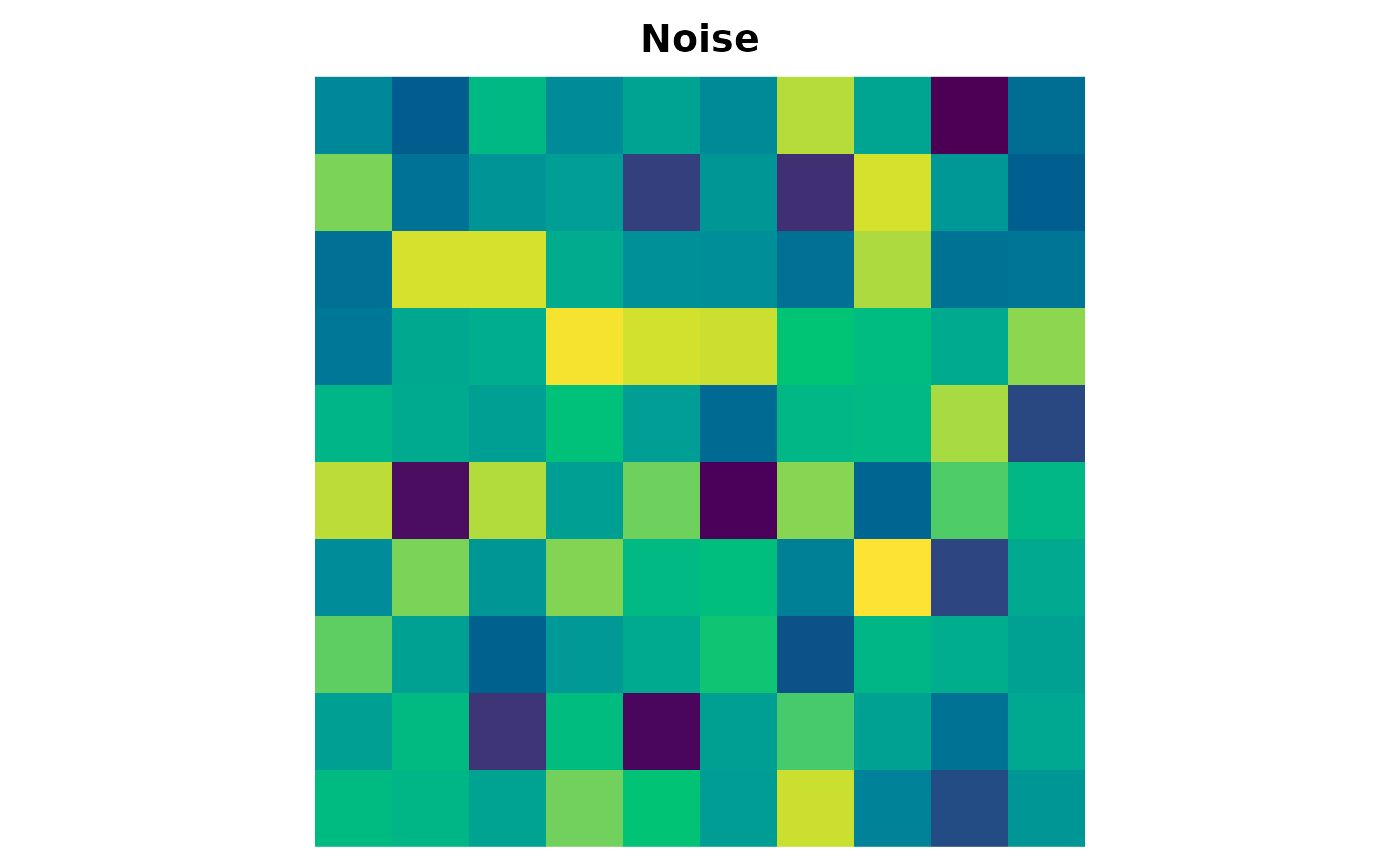
 plot_map(matrix(rnorm(100), 10), main = "Noise")